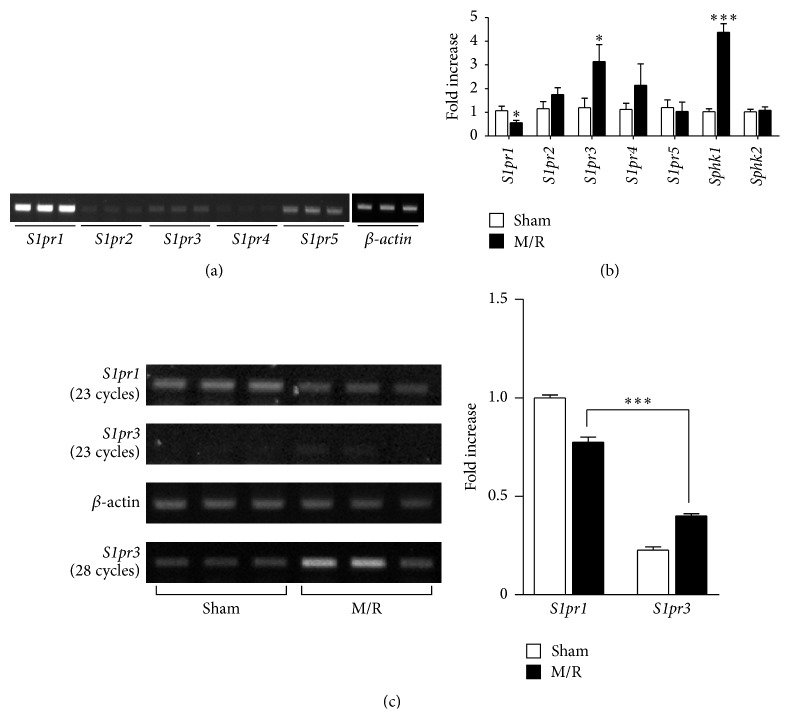
Figure 2.
mRNA expression levels of S1P receptors and S1P-producing enzymes are altered in an M/R-challenged brain. (a) Normal brains were used to determine mRNA expression levels of S1P receptors (S1pr1, S1pr2, S1pr3, S1pr4, and S1pr5) and SPHKs (Sphk1 and Sphk2) based on semiquantitative RT-PCR analysis (28 cycles for all targets). (b, c) Mice were challenged by 90 min occlusion followed by 22 h reperfusion. (b) Brain samples were used to determine changes of S1P receptors and SPHKs based on qRT-PCR analysis. ∗ P < 0.05 and ∗∗∗ P < 0.001, compared with the sham group (t-test), n = 5 per group. (c) Brains from sham and M/R-challenged mice were used to determine mRNA expression levels of S1P1 and S1P3 by semiquantitative RT-PCR analysis. Band intensity (bar graph) was calculated as fold increase relative to S1pr1 level of sham groups after normalization to β-actin. ∗∗∗ P < 0.001, compared with S1pr1 level of M/R group (Newman-Keuls test), n = 3 per group.

