
Figure 4.
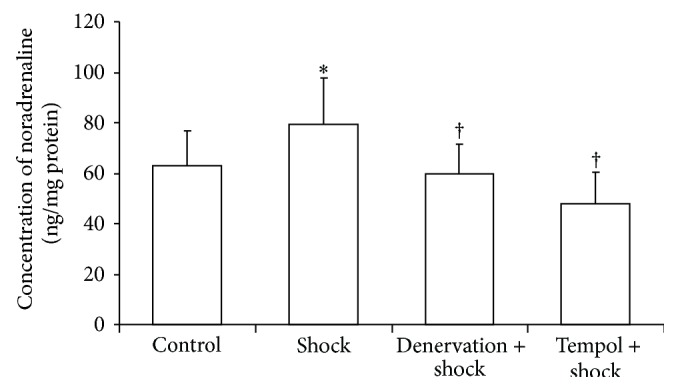
Plasma concentrations of noradrenaline. Concentrations of noradrenaline in plasma in each group after two-week stress were measured as described in Materials and Methods section. Data of each group (n = 15) were presented as mean ± SEM. * P < 0.05 compared with control group. † P < 0.05 compared with stress group.