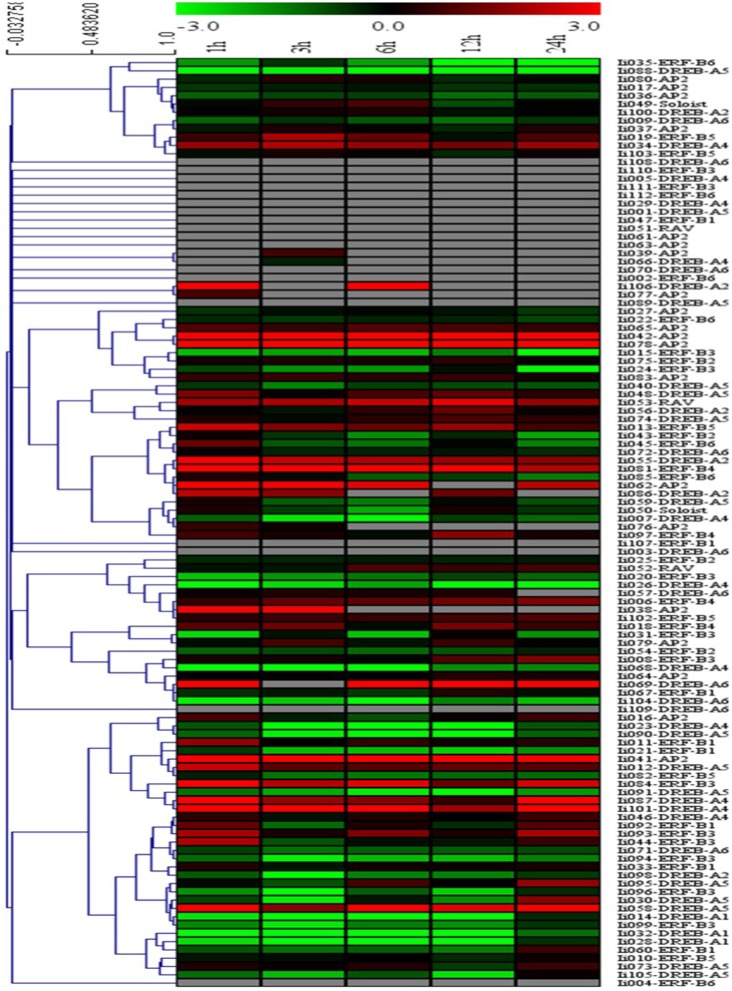
Figure 4.
Cluster analysis of the differentially expressed AP2/ERF genes identified in I. indigotica. Hairy roots of I. indigotica were treated with MeJA for 0, 1, 3, 6, 12, and 24 h and transcript abundance was measured via Illumina RNAseq analysis. The 0 h time point was used as control. Fold-change differences in transcript abundance are illustrated as heat map on a natural log scale (treatment/control). Samples with non-undetectable signals are depicted in gray.

