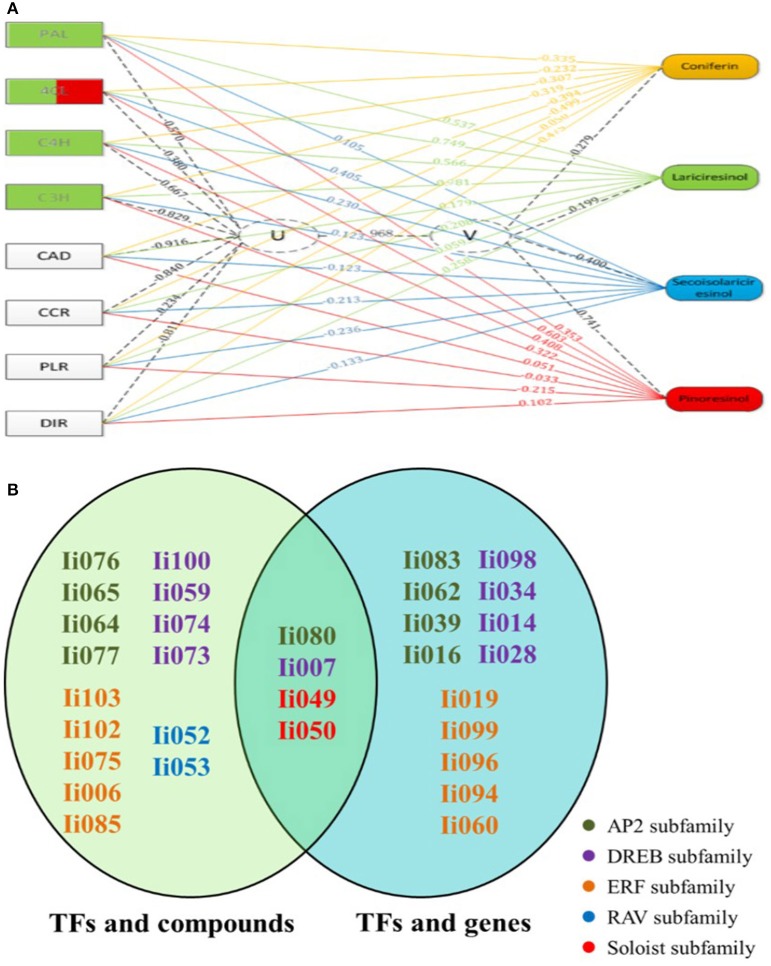
Figure 5.
Canonical correlation analysis using Pearson's correlation coefficient. (A) Exemplary gene-to-metabolite network in MeJA-elicited I. indigotica hairy roots. Genes are depicted as squares on the left, and metabolites on the right. The canonical correlation coefficient between two canonical correlation variables (U and V) was 0.968. The correlation coefficient between raw variables (genes and metabolites) and canonical correlation variables (U and V), is illustrated as corresponding dotted lines. Number associated with lines represent the variable correlation coefficient, and the gene color illustrate the level of gene-to-metabolite correlation: edges depict variable correlation coefficients of >0.50 and blue represents a higher correlation to lariciresinol. (B) List of 19 AP2/ERFs with possible roles in regulating the accumulation of lignans. The left oval shows the result of canonical correlation analysis between AP2/ERFs and pathway metabolites, and the right oval shows the result of the analysis between AP2/ERFs and biosynthetic genes. Different families are color coded. Particularly, four common AP2/ERFs (Ii080, 007, 049, and 050) show high probability for functions regulating the biosynthesis of lignans.

