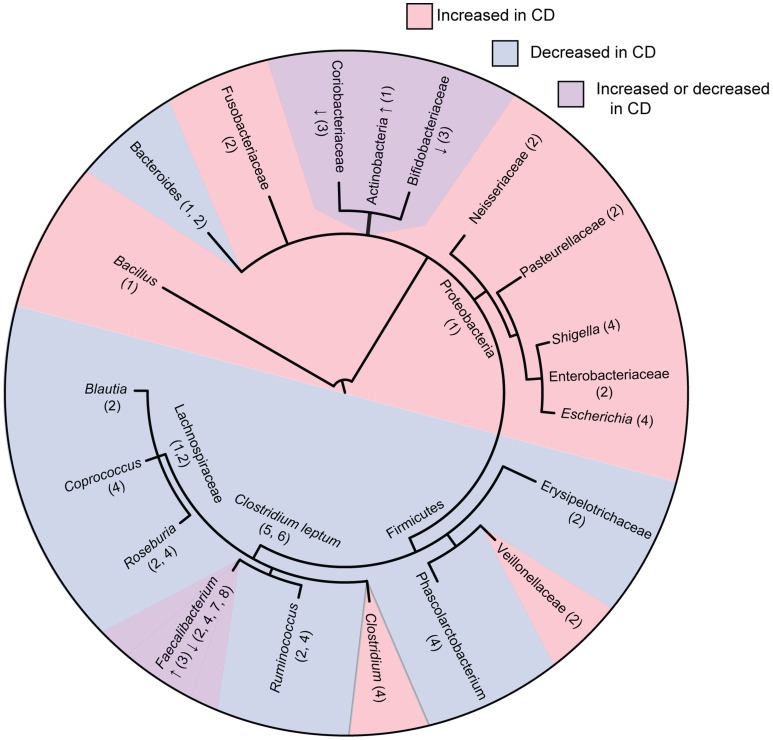
Figure 1.
Phylogenetic tree of bacterial groups associated with increased or decreased abundance in the gut microbiome of Crohn’s disease patients. In cases were bacterial groups have been associated both increases and decreases, studies showing increased abundance are indicated with “↑” and studies showing decreased abundance are indicated with “↓.” Numbers indicate references as follows; 1, Frank et al. (21); 2, Gevers et al. (27); 3, Hansen et al. (31); 4, Morgan et al. (22); 5, Sokol et al. (20); 6, Manichanh et al. (17); 7, Sokol et al. (32); 8, Sokol et al. (33). Tree topology was created using phyloT (http://phylot.biobyte.de/) and the figure was made using ITOL (http://itol.embl.de/).

