
Figure 1.
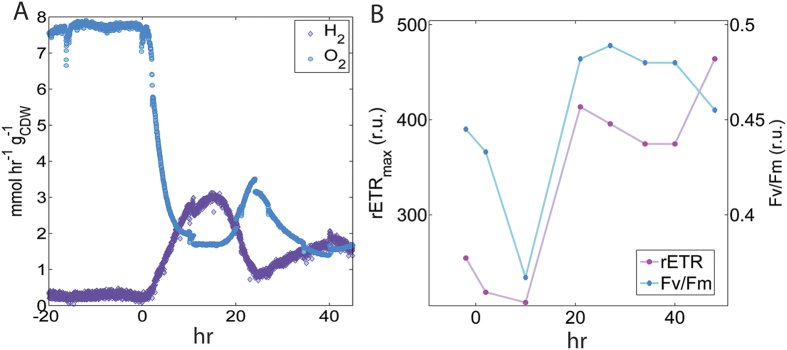
(A) Specific rates of net H2 and O2 production. Time zero indicates onset of nitrogen-depletion and absence of media addition (dilution rate = 0). (B) Variable chlorophyll fluorescence originating from PS II: the maximum relative electron transfer rate (rETRmax) and the optimal quantum yield (Fv/Fm). Data plotted at times prior to t = 0 represent measurements taken during the ammonia limited chemostat (i.e., steady-state precondition).