
Figure 3. Learning performances in the DMTP task.
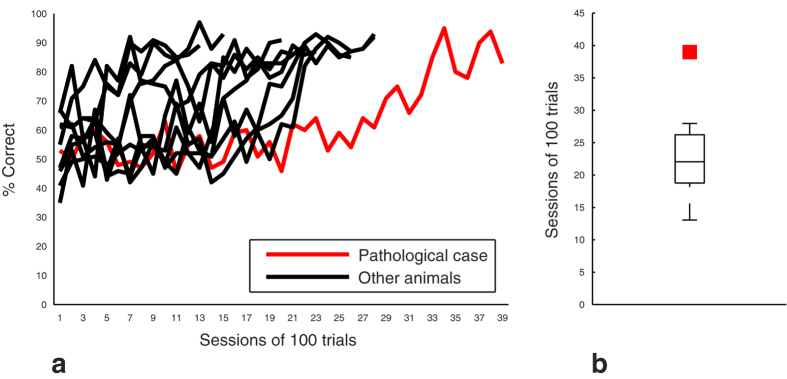
(a) Individual learning curves. Data were calculated after discarding correction trials (see methods). (b) Number of sessions to reach the learning criterion. Data are represented as median and interquartile intervals. The red square represents the performance of the PathC.