
Figure 5. Evolution of the response strategies in the randomized-delay step in the DMTP task.
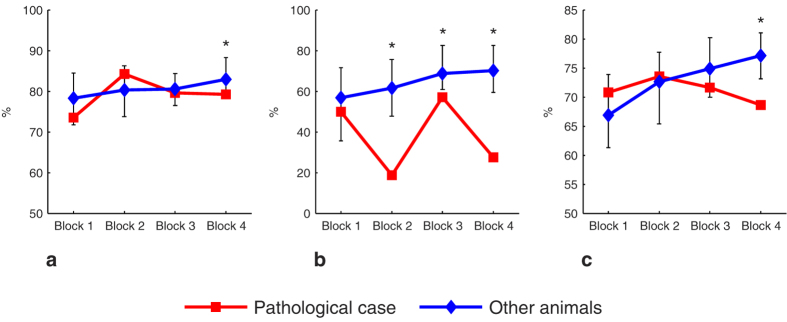
(a) WSt sub-strategy. (b) LSh sub-strategy. (c) ChSh strategy. Error bars represent the bias-corrected and accelerated bootstrap confidence intervals (P < 0.006). *Significant.