
Figure 6. MRI images.
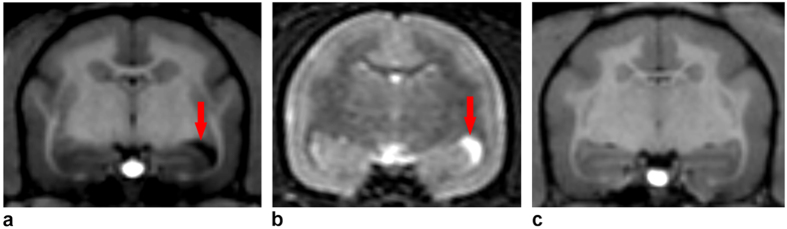
MRI T1 and T2 weighted scans showing the contrast between the abnormal ventricular enlargement (arrow) in the PathC (a,b) and another animal (c)
Official websites use .gov
A
.gov website belongs to an official
government organization in the United States.
Secure .gov websites use HTTPS
A lock (
) or https:// means you've safely
connected to the .gov website. Share sensitive
information only on official, secure websites.
MRI T1 and T2 weighted scans showing the contrast between the abnormal ventricular enlargement (arrow) in the PathC (a,b) and another animal (c)