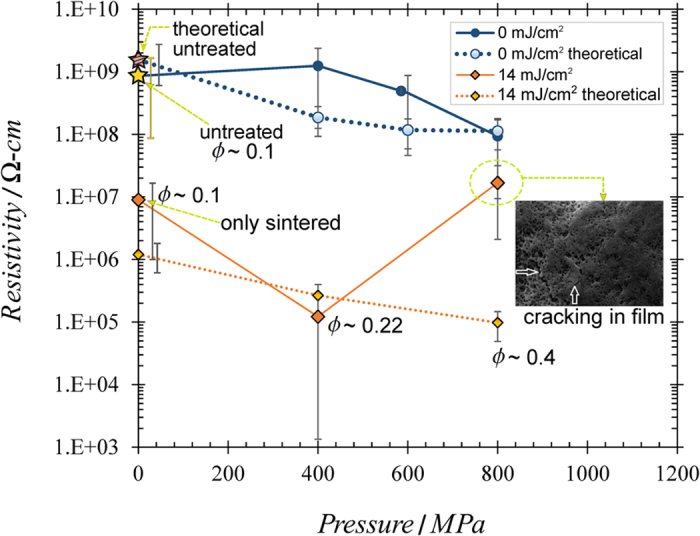
Figure 8. Measured film resistivity compared with theoretical resistivity, as a function of pressure applied during the laser peening phase.

Measured resistivity values and theoretical values based on percolation theory are shown. For clarity, values are shown only for the unsintered and 14 mJ/cm2-sintered samples. The volume fraction ϕ is shown next to some data points to convey the increase in this value as the compression pressure increases. The inset image shows the cracks that were found in an 800 MPa compressed, 14 mJ/cm2-sintered film16. This indicates that the high compression may cause fatigue in the film. This fatigue may cause the film to crack once it is sintered16. These cracks may be the reason this sample has a much higher resistivity than the theoretical prediction16. Note: we have obtained permission from SPIE to reprint the inset image in this figure. We originally used it in our previous work, reference 16.
