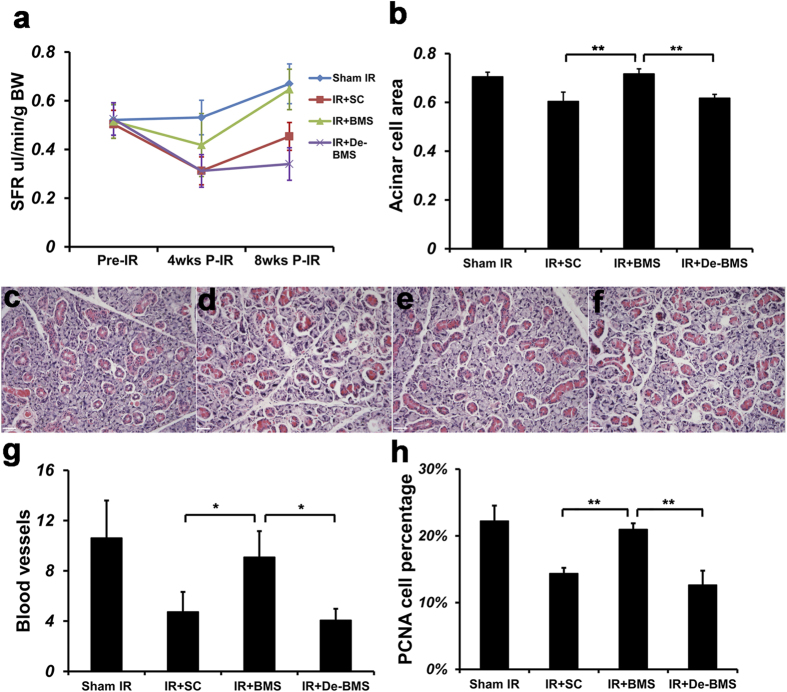
Figure 2. Role of BM Soup and ‘deactivated BM Soup’ on SFR, cell proliferation, acinar cells and blood vessels.
(a) Salivary flow rate (SFR) was determined by volume of saliva/10min/g body weight at pre-irradiation (Pre-IR), 4 weeks post-IR and 8 weeks post-IR. Then mice were sacrificed and submandibular glands were harvested at 8 weeks post-IR. Histological changes were examined for (b) Percentage of tissue surface area occupied by acinar cells/total area; H&E staining of mouse submandibular glands for the (c) Sham IR group; (d) Saline Control group; (e) BM Soup group; (f) Deactivated BM Soup group. Scale bar is 38 μm. (g) Number of blood vessels were calculated under 200 X magnification of 10 fields per gland/mouse with NIH image J software. (h) Percentage of PCNA positive cells was counted under 400 X magnification. Two examiners independently analyzed in a blind manner. *P < 0.05; **P < 0.01, n = 5 mice per group. All data were presented with mean ± S.D. BMS: BM Soup; De-BMS: deactivated BM Soup; SC: saline control.

