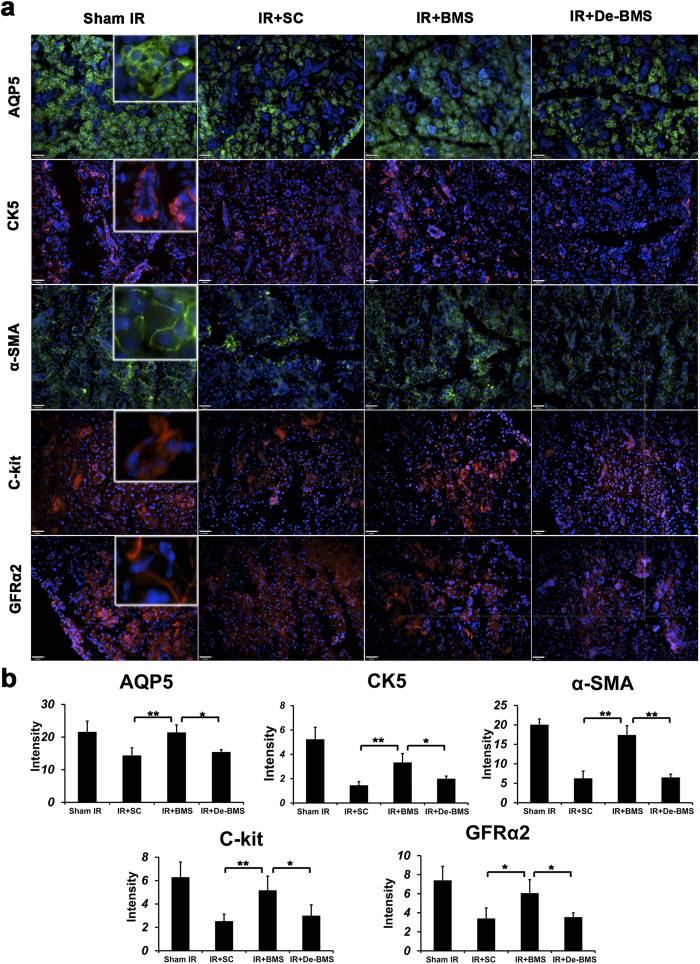
Figure 3. Special subpopulation of gland cells was detected by immunofluorescent staining at 8 weeks post-irradiation.
(a) The cells positive for AQP5 (marker of acinar cells), α-smooth muscle actin (marker for myoepithelial cells), CK5 (marker for ductal cells), c-Kit (marker for stem/progenitor cells), and GFRα2 (marker for parasympathetic nerves) were detected on frozen sections of salivary glands. Scale bar is 38 μm. All photographs were taken at 200 X magnification. (b) Quantification of protein immunofluorescent expression in 5 random fields/glands by Image J software (n = 5 mice per group; *P < 0.05, **P < 0.01). BM Soup group has higher protein intensity, when compared with deactivated BM Soup group. SC: saline control; BMS: BM Soup; De-BMS: deactivated BM Soup.

