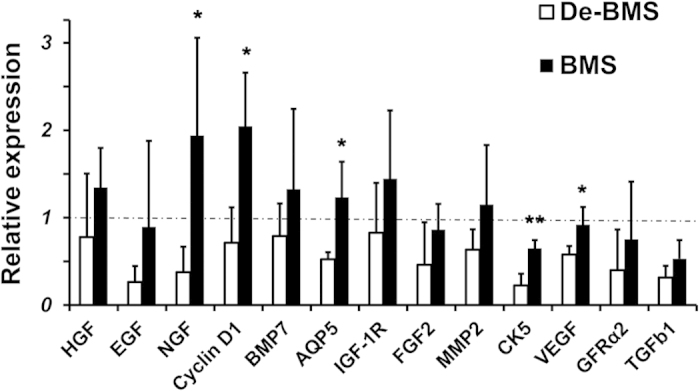
Figure 4. Relative expression of genes in salivary glands at week 8 post-irradiation.

Expression levels of genes related to tissue repair/regeneration were analyzed by quantitative RT-PCR. Gene expression levels were significantly higher in BM soup-treated group than that of the deactivated BM soup for AQP5, CK5, VEGF, NGF and Cyclin D1 (cell cycle G1/Synthesis). Y-axis shows the relative expression of the gene compared to GAPDH. Horizontal dashed line represents the relative gene expression level of 1 in mice from the Control group (sham-irradiated mice). *P < 0.05, **P < 0.01; n = 5 mice. Three experimental replicates were conducted for each sample. BMS: BM Soup; De-BMS: deactivated BM Soup.
