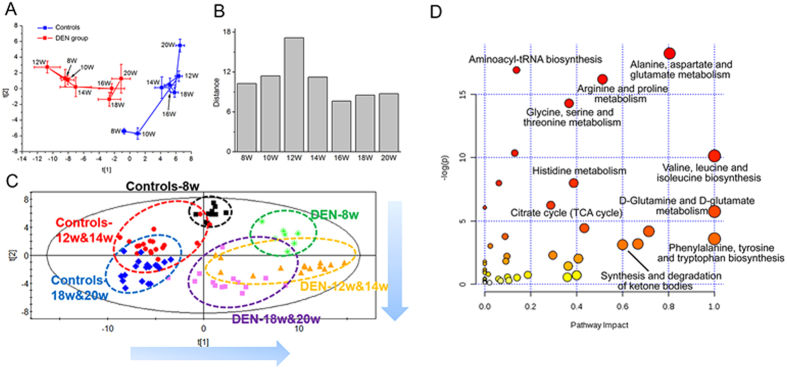
Figure 2. Metabolic profiling and comparison between model and control rats.
(A) Metabolic trajectories of control and DEN rats based on PCA. Each point represents the average score values of samples with standard error (SE). (B) Euclidean distance between control and DEN groups. (C) Metabolic changes of the animal model. This PLS-DA model passed cross validation without overfitting. (D) The most relevantly disturbed pathways.

