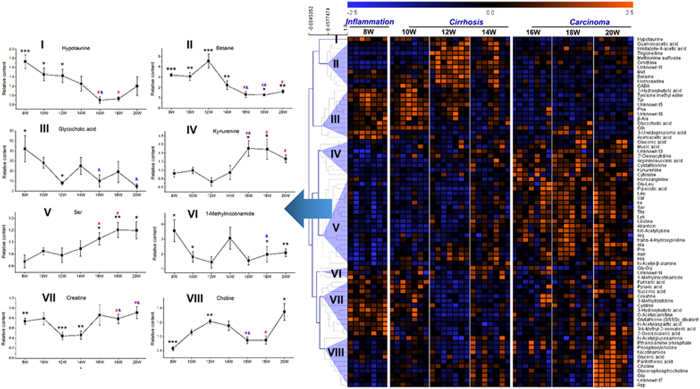
Figure 4. Metabolites clustering and response trajectory analysis.
Defined metabolites were clustered based on the similarity of response pattern (right panel). Representative metabolites were selected from each cluster to present the response trajectory (left panel). Each point in the trajectory was presented as the average relative content ± SE. The black * means the statistical significance between DEN group and age-matched controls. The red # (or blue &) means the statistical significance between week 12 (or week 14) and the corresponding week. *,#,&0.01 < p < 0.05, **0.001 < p < 0.01 and ***p < 0.001.

