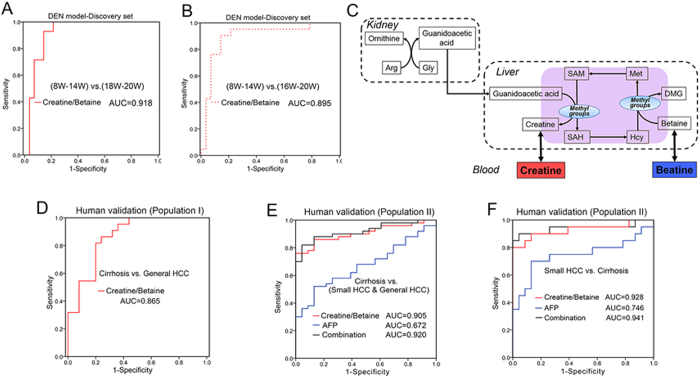
Figure 6. Evaluation of potential biomarker.
(A,B,D–F) are ROC curves. Diagnostic potential was evaluated based on binary logistic regression. (C) Metabolism of betaine and creatine. Arg, arginine; Gly, glycine; Met, methionine; SAM, S-adenosylmethionine; SAH, S-adenosylhomocysteine; Hcy, homocysteine; DMG, dimethylglycine.

