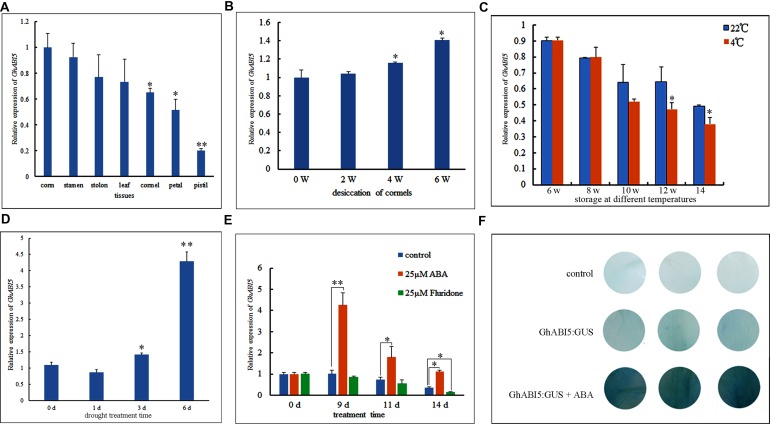
FIGURE 4.
Quantitative real-time PCR analysis of GhABI5 expression levels and GhABI5 promoter analysis. (A) GhABI5 expression levels in various organs. (B) GhABI5 expression during storage at 22°C. (C) The effect of temperature and duration on the expression of GhABI5. (D) The expression of GhABI5 under drought treatment (0, 1, 3, 6-days); (E) The expression of GhABI5 in cormels treated with ABA and fluridone (0, 9, 11, 14-days). (F) Transient expression of GhABI5:GUS in Gladiolus petal disks with 50 μM ABA. Error bars represent the SE of three biological replicates. (∗P < 0.05; ∗∗P < 0.01).

