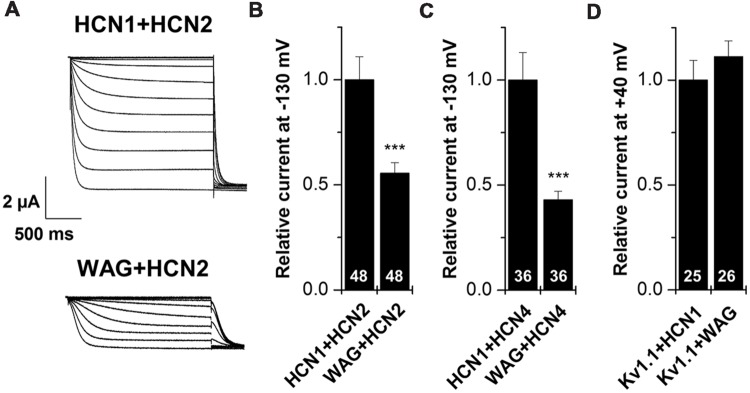
FIGURE 3.

Co-expression of HCN1 or WAG-HCN1 with other HCN family members. (A) Representative current traces of the co-expression of HCN1 or WAG-HCN1 with HCN2. (B) Co-expression with WAG-HCN1 causes a significant decrease in current amplitude analyzed at -130 mV. The number of experiments are indicated in the bar graphs. (C) Co-expression of WAG-HCN1 with HCN4 shows a significant decrease in current amplitude analyzed at -130 mV. The number of experiments are indicated in the bar graphs. (D) Relative current amplitudes (at +40 mV) for Kv1.1 after co-expression with HCN1 or WAG-HCN1 with HCN2. The number of experiments are indicated in the bar graphs. ∗∗∗p < 0.001.
