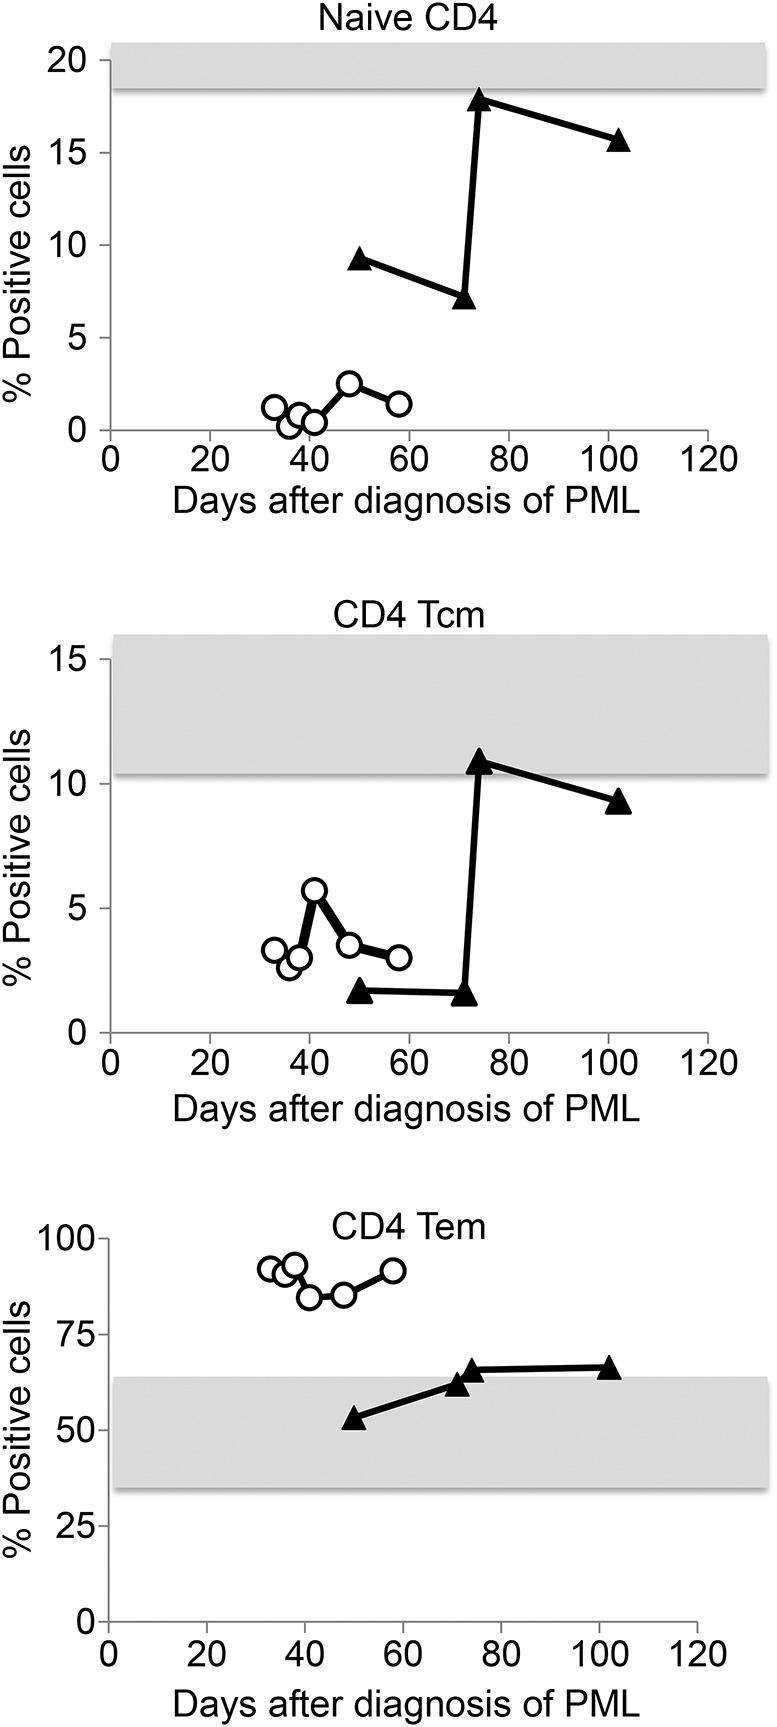
Figure 4. Longitudinal analysis of peripheral immune cell composition.

Frequency of naive, central memory (Tcm), and effector memory (Tem) CD4 T cells over the course of PML in patient 1 (open circles) and patient 2 (closed triangles). Gray areas indicate normal values (mean values ± 2 SDs of healthy controls). Timeline indicates days after diagnosis of PML. PML = progressive multifocal leukoencephalopathy.
