
Figure 2.
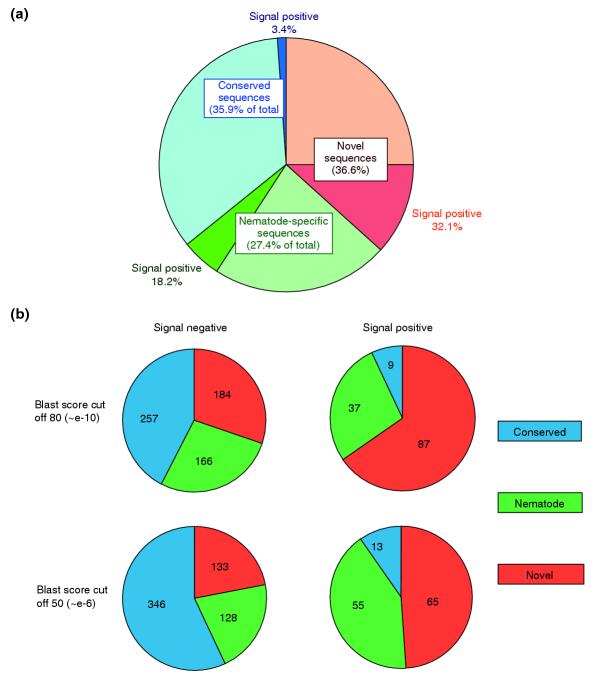
Proportion of ESTs predicted to encode signal sequences. (a) EST sequences were classified as conserved (similarities to non-nematode database entries), nematode-specific (similarities only to C. elegans or other nematode sequences), or novel (no similarities to existing entries), using a cutoff score of 80 in BLASTX (P < e-10). The number of ESTs bearing potential signal sequences was then calculated and the results are shown here. (b) Effects of relaxing cutoff scores on distribution of signal peptide-containing predicted gene products among conserved, nematode-specific and novel categories. Numbers of clusters in each category are given for cutoffs of 80 (P <e-10), as used in (a), and 50 (P <e-6).