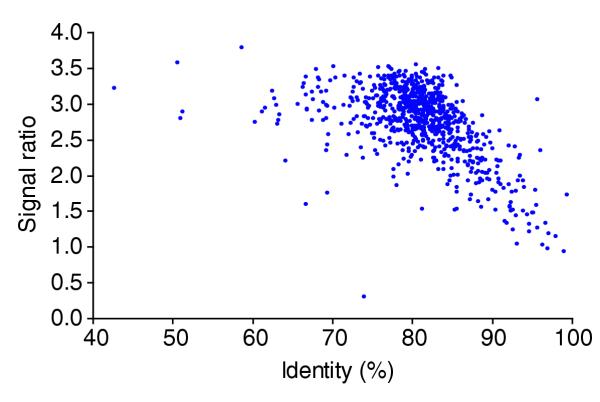
Figure 2.

Relationship between the signal ratios and sequence identities for the MoPn vs D/UW-3 DNA microarray. The average signal ratio of each orthologous gene pair between C. trachomatis serovars D/UW-3 and MoPn was log2 transformed. These values were then compared to the corresponding nucleotide identity for each gene pair, yielding a linear association.
