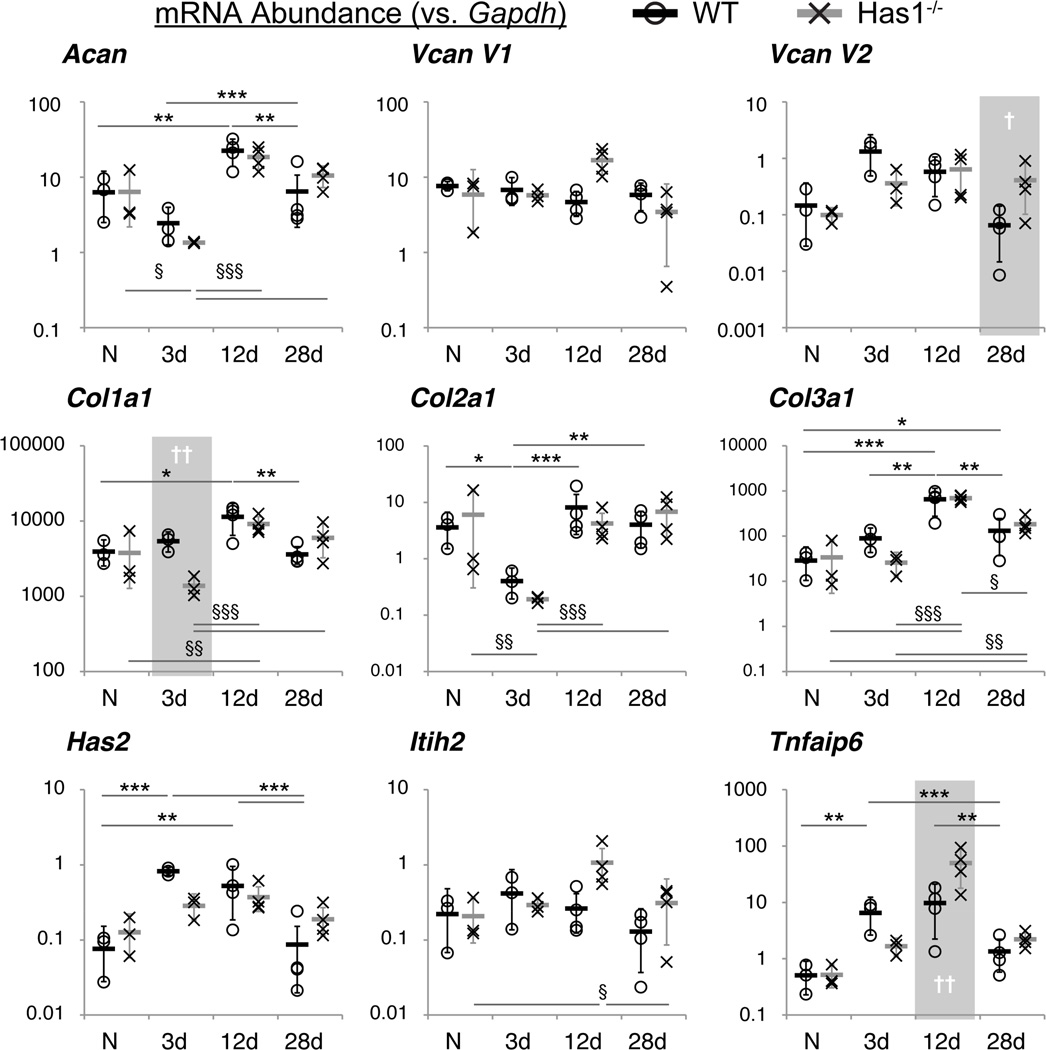
Figure 5. Expression of selected ECM and HA network genes in WT and Has1−/− joints.
Gene expression, calculated as mRNA abundance relative to Gapdh (see Methods), of WT (circles) and Has1−/− (crosses) whole joints at each time point (naïve (N) & 3d: n = 3; 12d & 28d: n = 4) is shown for each biological replicate. Means within each group are shown as a thick black or gray bar, and the error bars represent the transformed upper and lower bounds of a 95% confidence interval for the two genotypes at each time point. Statistical significance between time points, after two-way ANOVA and correction for multiple comparisons (see Methods), at P < 0.05 (*/§), P < 0.01 (**/§§), and P < 0.001 (***/§§§), between time points are indicated for WT/Has1−/− joint gene expression. Statistically significant differences between genotypes are indicated for P < 0.05 (†) and P < 0.01 (††) and highlighted with a gray area.

