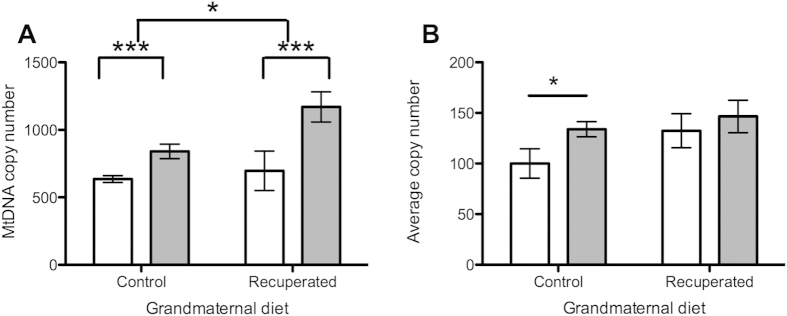
Figure 4. Effect of grandmaternal diet and offspring age on ovarian mtDNA.
Open bars represent results at 3 months of age, gray bars represent results at 6 months of age. *denotes p < 0.05, ***denotes p < 0.001 (A) MtDNA copy number (ratio to single copy nuclear gene) in ovarian tissue. (B) Expression of Tfam (regulator of mtDNA biosynthesis) in ovarian tissue.

