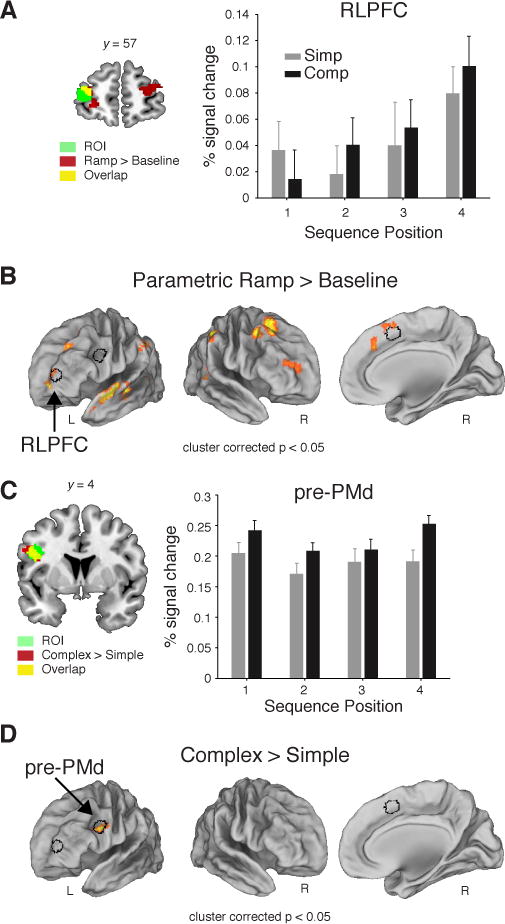
Figure 2.

Results from the fMRI experiment. (A) Mean percent signal change (+SEM) from the peak (6 s) of the FIR from the voxels included the unbiased RLPFC ROI. (B) Voxelwise contrast of the Parametric Ramp regressors (see Experimental Procedures, Figure 3B) over baseline (extent threshold 172 voxels, note lateral views rotated ~50°). (C) Same as (A) for pre-PMd ROI. (D) Voxelwise contrast of all Complex > Simple sequences (extent threshold 185 voxels). All contrasts were family-wise error cluster corrected for multiple comparisons at P < 0.05. Outline of the RLPFC, pre-PMd, and SMA/pre-SMA (see SI) ROIs in black shown in A and D. See also Figures S1, S2.
