Figure 5.

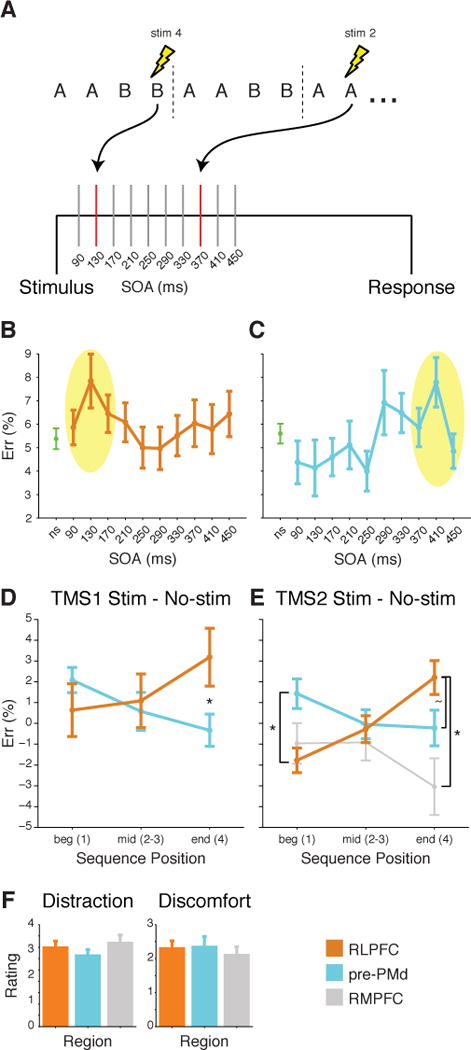
TMS design and results. (A) SpTMS was delivered at one of 10 SOA at most once in each 4-trial sequence. (B&C) Mean ER (±SEM) across all Positions for no-stimulation (ns) and stimulation trials at 10 different SOA for (B) RLPFC and (C) pre-PMd. Yellow oval indicates points included for analysis at the peak stimulation SOA. (D) Mean difference in ER (±SEM) due to stimulation at peak SOA for RLPFC and for pre-PMd in TMS1. ER differences shown over the course of sequences: beginning (Position 1), middle (Positions 2 and 3), and end (Position 4). Asterisk indicates significant difference in the effect of stimulation at Position 4 (F1,32 = 6.7, P < 0.01). (E) Same as D but for TMS2. Asterisk at Position 1 indicates a reliable difference between RLPFC and pre-PMd (F1,28 = 6.2, P < 0.02). At Position 4, tilde indicates a marginal difference between RLPFC and pre-PMd (F1,28 = 2.9, P < 0.1), and asterisk indicates a reliable difference between RLPFC and RMPFC (F1,14 = 4.4, P < 0.05). (F) Mean post-test questionnaire ratings (±SEM) of the amount of distraction (1–5, left) and discomfort (0–5, right) in TMS2. See also Figures S4, S5.
