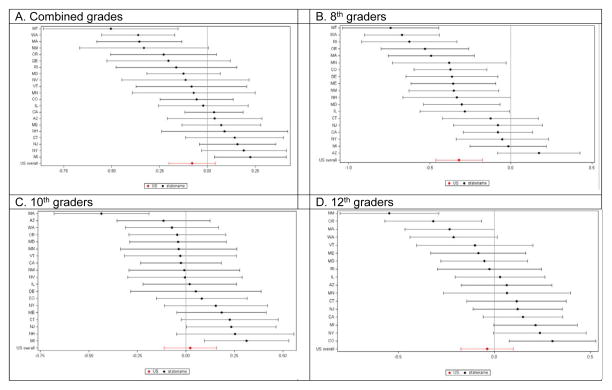
Figure 3.
Plotted log odds ratios for adolescent marijuana use pre vs. post passage of MMLa
aPost-passage includes the year in which the law was passed. Values > 0 indicate increased log odds ratios of past month marijuana use post-MML compared to pre, values < 0 indicate a decrease. Error bars represent 95% confidence intervals for each state-specific estimate. State estimates for each grade are not shown when a state did not have pre or post MTF data available within that grade (for 8th grade, NV does not have pre MML data and VT does not have any 8th grade data. For 10th grade, MT does not have pre MML data and RI does not have any 10th grade data. For 12th grade, DE, MT and NV do not have pre MML data, and NH does not have post MML data).

