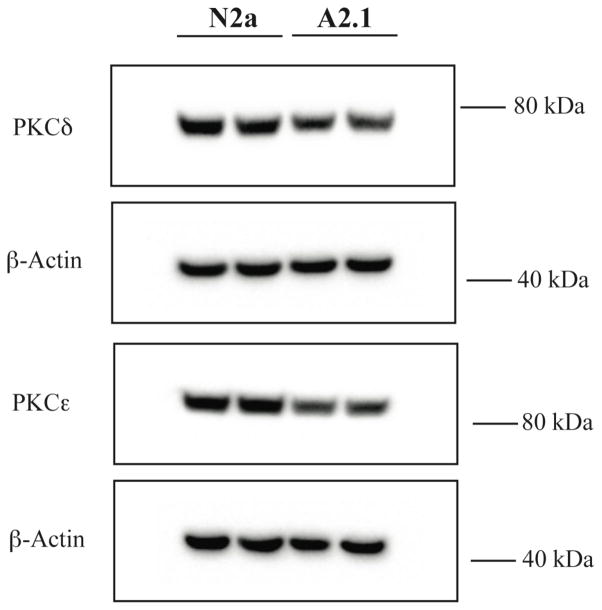
Figure 4. Mass of protein kinase C isoforms PKCδ and PKCε is reduced in ABCA2-overexpressing cells.
Protein lysates from N2a, A2 cells were fractionated on 4–12% NuPAGE gels transferred to nitrocellulose and probed by Western blot with the PKCδ antibody (78 kDa) and PKCε antibody (90 kDa). The results are the mean % change in protein mass in A2 cells compared to N2a cells ± SD of duplicate determinations.

