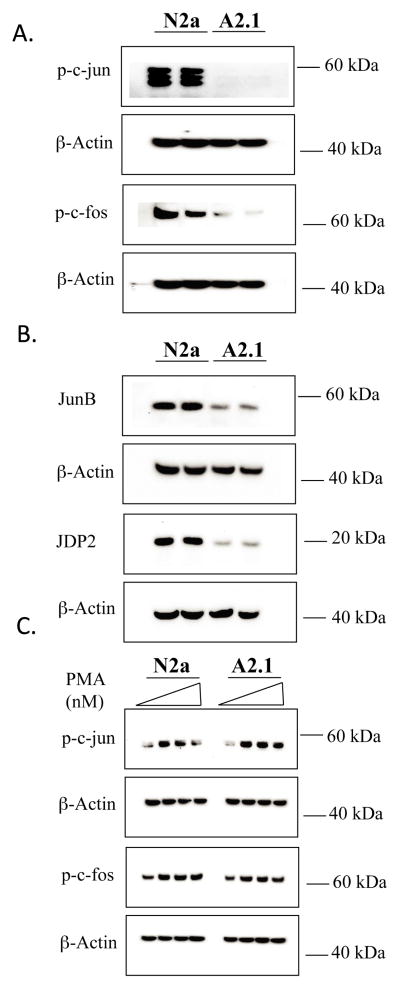
Figure 7. Western blot of AP-1 proteins in N2a and A2 cells.
Whole cell homogenates from N2a and A2 cells were fractionated on 4–12% NuPAGE gels transferred to nitrocellulose and probed by Western blot with antibodies to (A) phospho-c-jun (48 kDa), phospho-c-fos (62 kDa); (B) JunB (42 kDa), or JDP2 (19 kDa). (C) N2a and A2 cells were treated with increasing amounts of PMA for 6 hours, nuclear homogenates were prepared and Western blot was performed with antibodies to phospho-c-jun and phospho-c-fos. The results are the mean % change in protein mass in A2 cells compared to N2a cells ± SD ≥ 3 determinations. Statistical significance was determined using the Student’s t test, p < 0.05.

