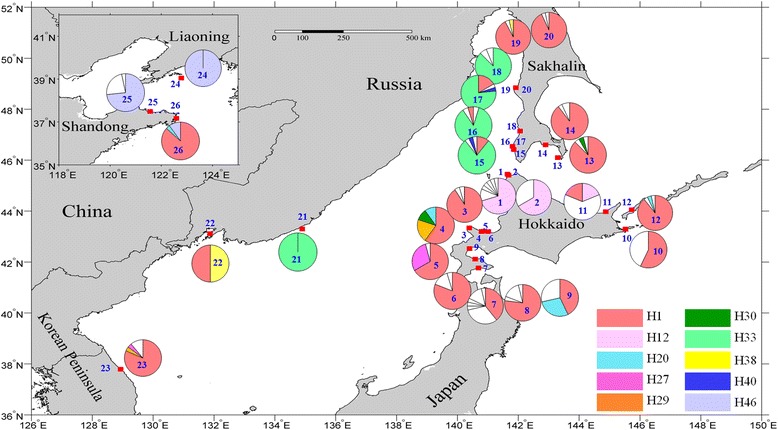
Fig. 2.

Distribution of the 53 combined mtDNA haplotypes detected in the 26 Saccharina japonica populations. Pie charts are labeled with the population numbers as shown in Table 1. The size of divisions inside each pie chart is proportional to the frequency of occurrence for individual haplotypes. Colors represent the shared haplotypes and private haplotypes are shown in white
