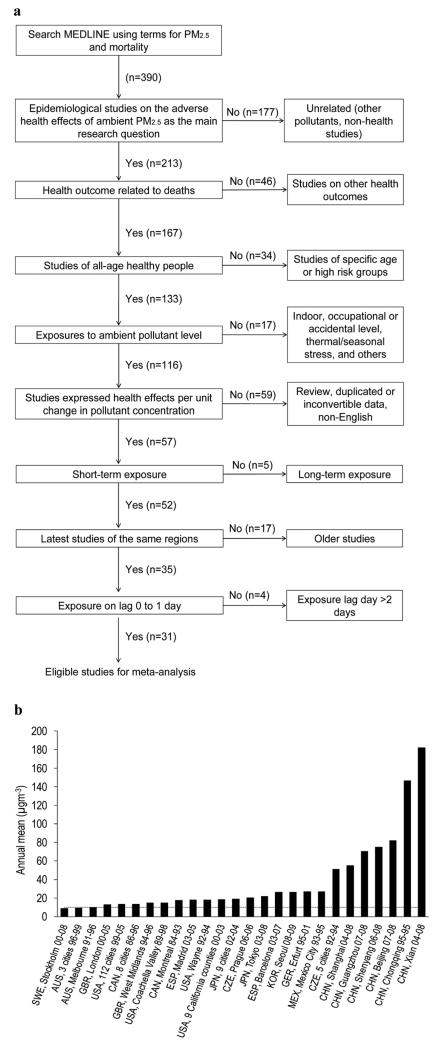
Fig. 2.
(a) Literature selection. (b) Selected literature' records of PM2.5 concentrations. Note: Only the annual mean concentrations of the latest exposure year in each city are shown. Three-letter country codes: Australia (AUS), Canada (CAN), China (CHN), Czech Republic (CZE), Germany (GER), Japan (JPN), Korea (KOR), Mexico (MEX), Spain (ESP), Sweden (SWE), United Kingdom (GBR), and United States (USA). The dotted line represents the WHO annual AQG of 10 μg m−3 for PM2.5.

