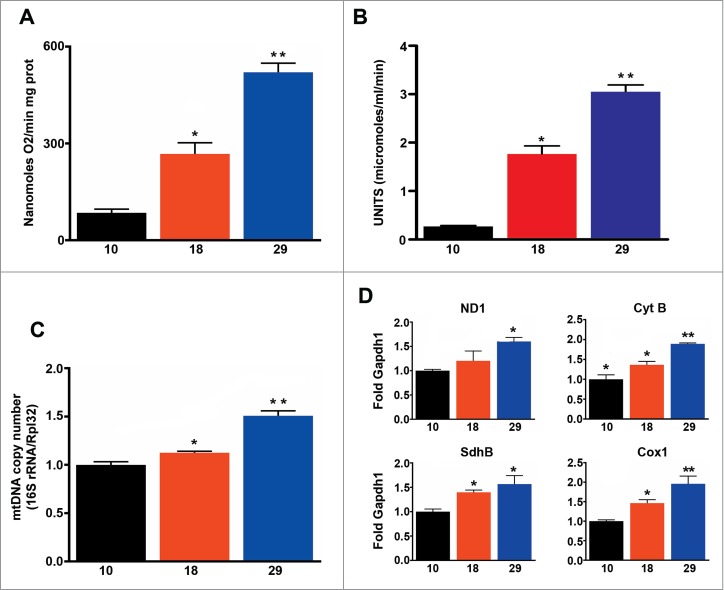
Figure 2.

Mitochondrial function correlates with metabolic rate, but not with the rate of aging. (A) Mitochondrial oxygen consumption (n = 5 − 9). (B) Mitochondrial density (n = 6 − 7). (C) Mitochondrial copy number (n = 3 − 4). d) qPCR analysis of ND1, Cyt-b, SdhB and Cox1 (n = 4 − 5). The mean ±SEM is shown (n indicates independent replicates per group). Different numbers of * indicate statistically significant differences (ANOVA, p < 0.05) between temperatures.
