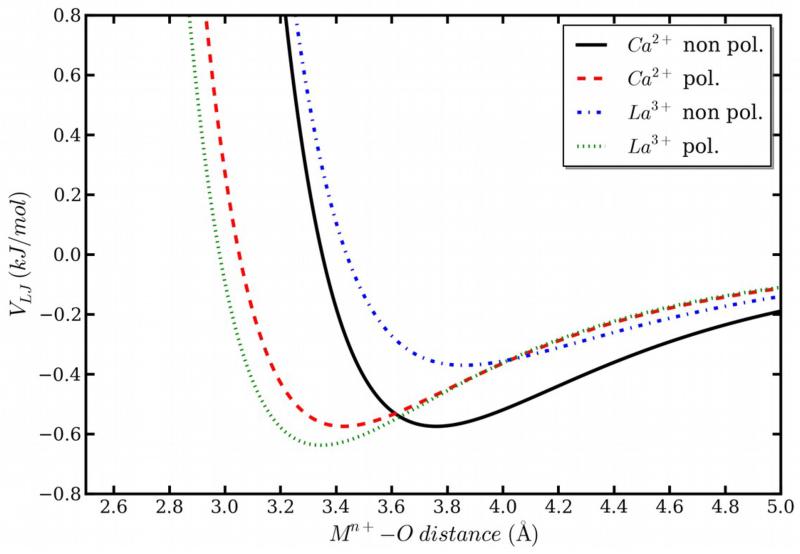
Figure 7.
Comparison of standard and modified Lennard-Jones potential energies used in Ca2+ and La3+ simulations. The full black line represents the standard potential energy taken from GROMOS96 for Ca2+; the red dashed line shows the modified potential used in Ca2+ simulations with FQ; the blue dot-dashed line shows the OPLS potential energy for La3+ with fixed charges; the green dotted line shows the shifted potential used in La3+ simulations with FQ.

