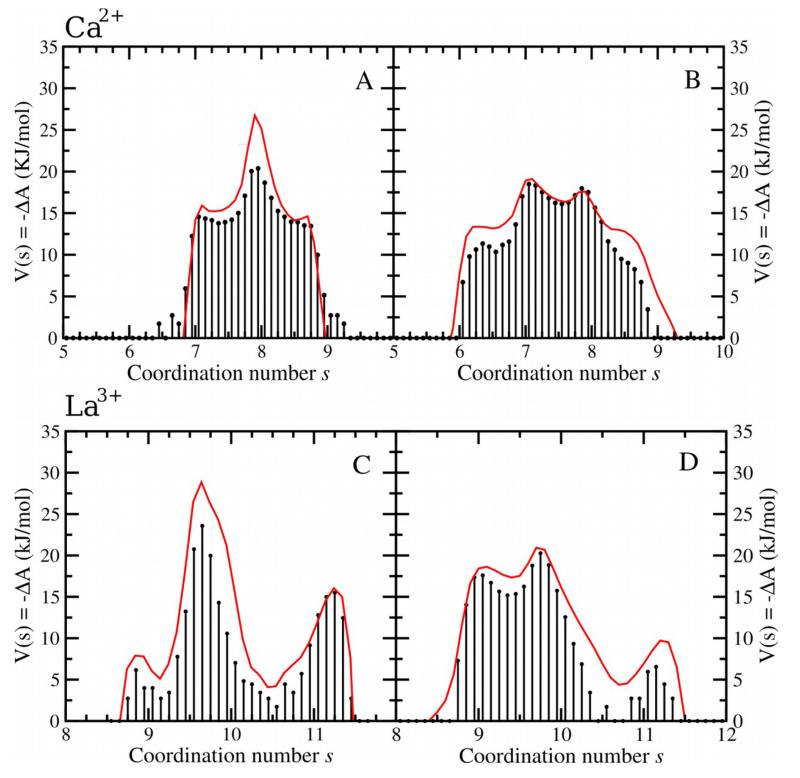
Figure 9.
Comparison of free energy profiles for the continuous coordination number, s, obtained from standard MD simulations (black histograms) and from metadynamics simulations (red lines) from the Ca2+ (top row, panels A and B) and La3+ (bottom row, panels C and D) simulations. Graphs on the left side (panels A and C) show results obtained using fixed charges, while those on the right side (panels B and D) contain results yielded by trajectories with fluctuating charges.

