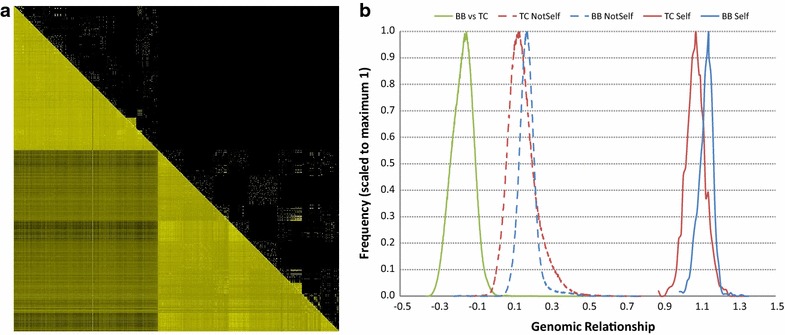
Fig. 2.

Genomic relationships. a Heat map of the relationship matrices. Above the diagonal is the pedigree-based numerator relationship matrix; below the diagonal is the SNP-based genomic relationship matrix. Animals were sorted such that the 817 Brahman cows appear first, followed by the 1028 Tropical Composite cows. The colour scheme goes from black to yellow for relationships of zero (none) and one (self), respectively. b Distribution of the genomic relationship coefficients within and across breeds
