
Fig. 1.
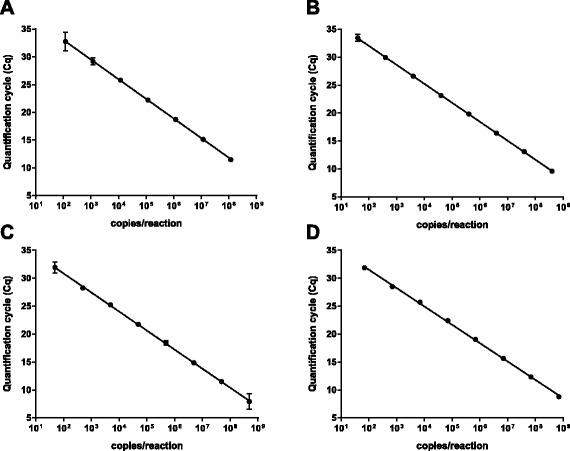
Linear dynamic range. The linear dynamic ranges of the RT-PCR assays were determined by testing triplicates of 10-fold serially diluted in vitro transcribed RNA. Panel (a) represents the DENV1 assay, and (b), (c), and (d) the DENV2, DENV3, and DENV4 RT-PCR assays, respectively. Each dot represents the mean Cq-value from three replicates, the error bars indicate 95 % confidence intervals, and the lines represents the best fitting lin-log regression models