
Fig. 2.
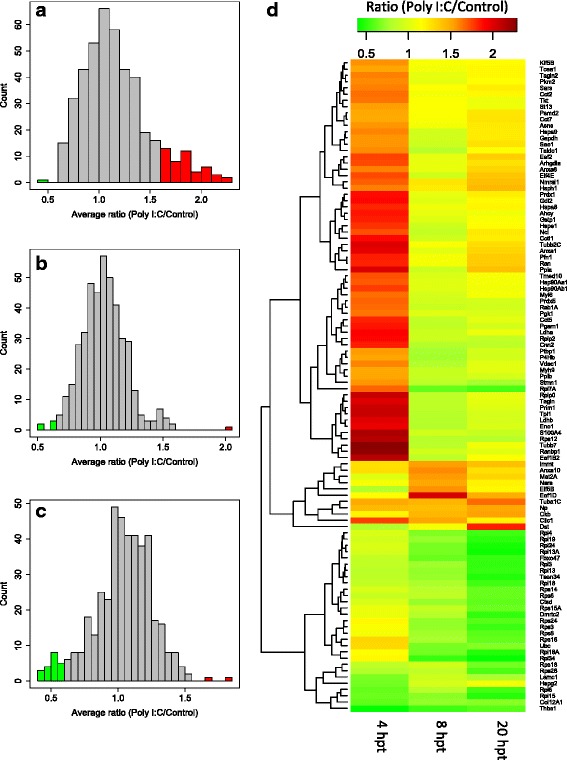
Analysis of iTRAQ data. a-c The average ratio of Poly I:C/Control of three biological replicates at 4 hpt (a), 8 hpt (b) and 20 hpt (c). Proteins with fold-change ≥ 1.5 are shown in red (up-regulated) and green (down-regulated). d Heatmap of 104 differentially regulated proteins at 4, 8 and 20 hpt