
Fig. 1.
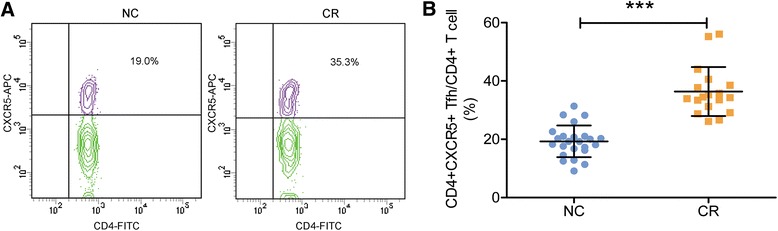
Frequency of Tfh cells in the patients with renal allograft. a, representative contour plots of the ratio of Tfh cells in the NC and CR groups, b, mean values of the frequency of Tfh cells in the two groups. ***, P < 0.001. Note a significant increase in Tfh cells in the CR group compared to that of the control group