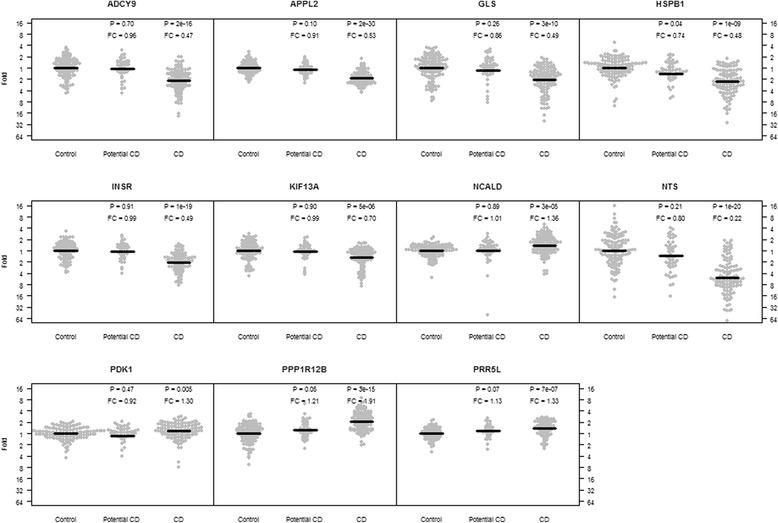
Fig. 1.

Gene expression in small intestinal mucosa vs. celiac disease status. Fold change and p-value are presented for the celiac disease group (n = 167) and the potential celiac disease group (n = 61) with the control group (n = 174) set as reference and adjusting for age and sex
