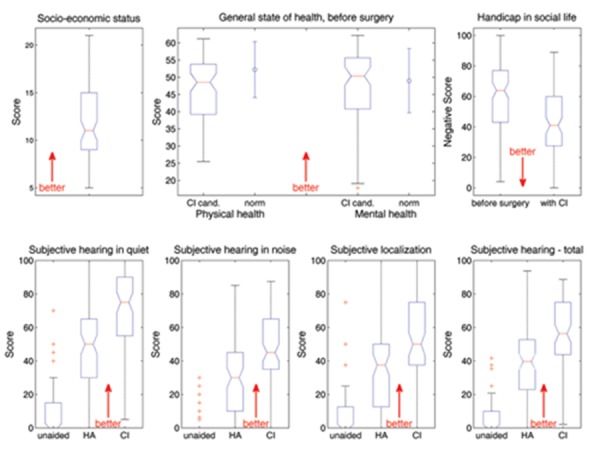
Figure 5.

Results of the questionnaires. (Top left) Socio-economic status. (Top center) General state of health as assessed before surgery by the SF-12 is given as a boxplot, subdivided into physical (left) and mental (right) health. The error bars adjacent to the boxplots represent the normative values taken from Bullinger and Kirchberger.28 (Top right) The handicap in social settings as assessed by the Gothenburg Profile is plotted before surgery (left) and after 6-month CI use (right). (Bottom) Results of the Oldenburger Inventar estimating subjective hearing ability in quiet (bottom left), in noise (bottom, second from left), subjective localization ability (bottom, second from right) and totalled to produce an overall score (bottom right). All variables are assessed unaided (on the left of each diagram), with own hearing aid (HA, middle) and with a CI after six months of use (right).
