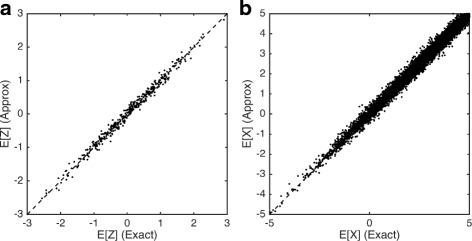
Fig. 2.

Comparison of exact and block-based EM algorithms. Plots show the correlation between expectations computed using the exact and block-based EM algorithms for latent low-dimensional positions (Z) (a) and latent observations X (b). Simulations were performed on a simulated data set with 500 genes and 200 cells. A block size of 50 was chosen for the approximate approach
