
Fig. 4.
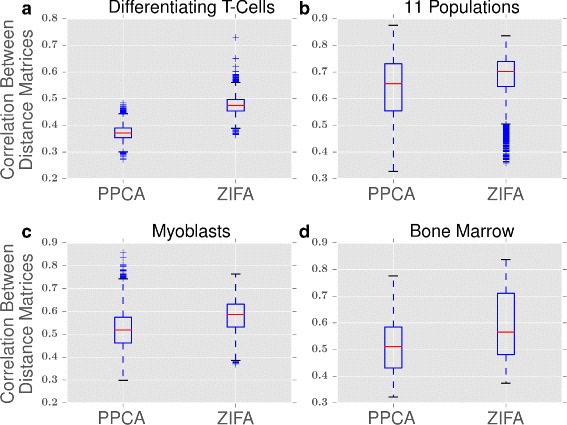
Consistency of cell-to-cell distances. Box plots showing the correlation between distance matrices for PPCA and ZIFA from 100 gene sets selected at random from (a) differentiating T cells [3], (b) 11 populations [15], (c) myoblasts [5] and (d) bone marrow [14]. The distance matrices produced by ZIFA are more correlated with each other than are the distance matrices produced by PPCA