
Fig. 6.
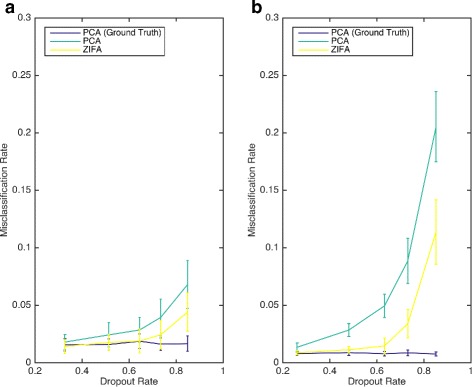
Understanding the relationship between cell type separability and dropout rate. This is a comparison of dimensionality-reduction techniques for cell typing. These plots show cell type misclassification rates (using QDA) as a function of dropout rate for the preprocessing using PCA and ZIFA on simulated data sets based on the (a) Pollen [15] and (b) Usoskin [16] data sets. The exact PCA results correspond to a ground-truth baseline when PCA is applied to simulated data with no dropout events