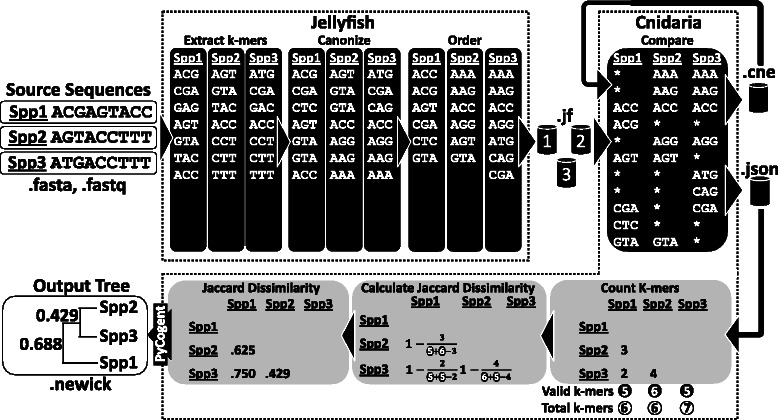
Fig. 1.

Cnidaria analysis summary. The JELLYFISH software reads each of the source sequence files (in Fasta or Fastq formats), extracts their k-mers (k = 3 in this example), canonizes them (by generating the reverse complement of each k-mer and storing only the k-mer which appears first lexicographically), orders them according to a deterministic hashing algorithm (in this example, alphabetically) and then saves each dataset in a separated database file (.jf). CNIDARIA subsequently reads these databases and compares them, side-by-side, by counting the total number of k-mers (white circles), the number of valid k-mers (k-mers shared by at least two samples, black circles) and the number of shared k-mers for each pair of samples as a matrix. Those values are exported to a Cnidaria Summary Database (CSD, a .json file) that is then used to construct a matrix of, by default Jaccard, distances between the samples (Formula 1). This dissimilarity matrix is then used for Neighbour-Joining clustering and exported as a NEWICK tree. Alternatively, Cnidaria can export a Cnidaria Complete Database (CCD, a .cne file) containing all k-mers and a linked list describing their presence/absence in the samples. This second database can be used as an input dataset together with other .cne or .jf files for new analysis
