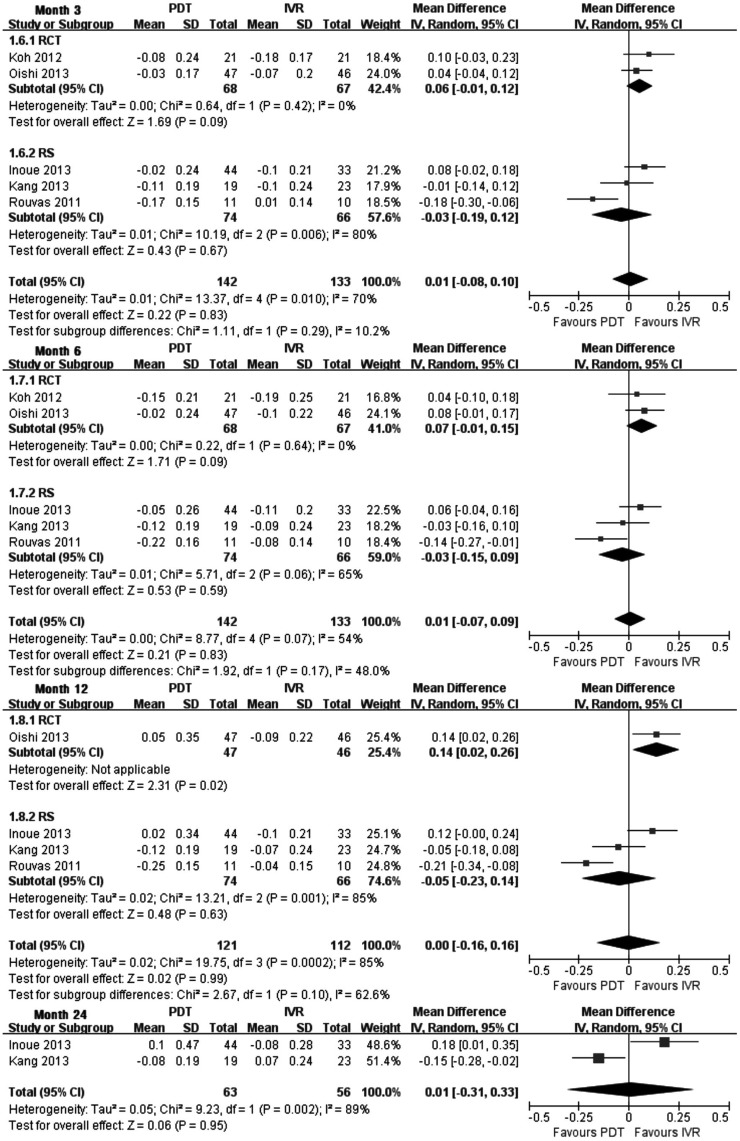
Figure 1. Mean change of BCVA from baseline at months 3, 6, 12 and 24 PDT vs IVR.
Each square represents a study and the size is proportional to the precision of the mean treatment effect in that study. The horizontal line represents 95%CI of each study for the treatment effect. The center of the diamond is the average treatment effect across studies, and the width of diamond denotes its 95%CI. RCT: Randomized controlled trial; RS: Retrospective study.

