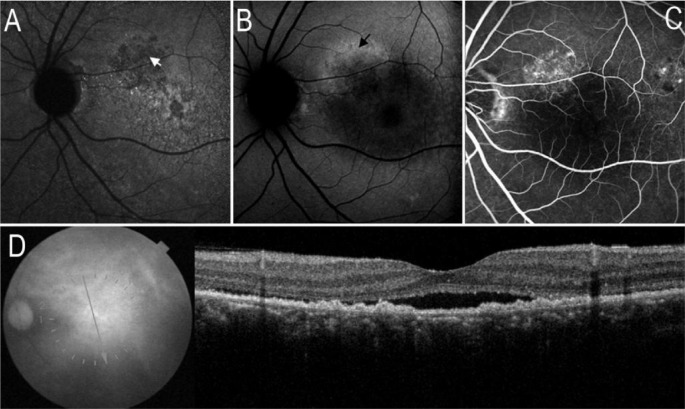
Figure 5. RPE mass deposits on images of AF and SD-OCT.
A: IR-AF image showed a area with granular hypo-AF (white arrow); B: SW-AF image showed a area with granular hyper-AF (black arrow) corresponding to the area of hyper-SW-AF; C: FA image revealed a window defects area; D: SD-OCT showed irregular mass deposits on RPE corresponding to the abnormalities of hypo-IR-AF or hyper-SW-AF.

