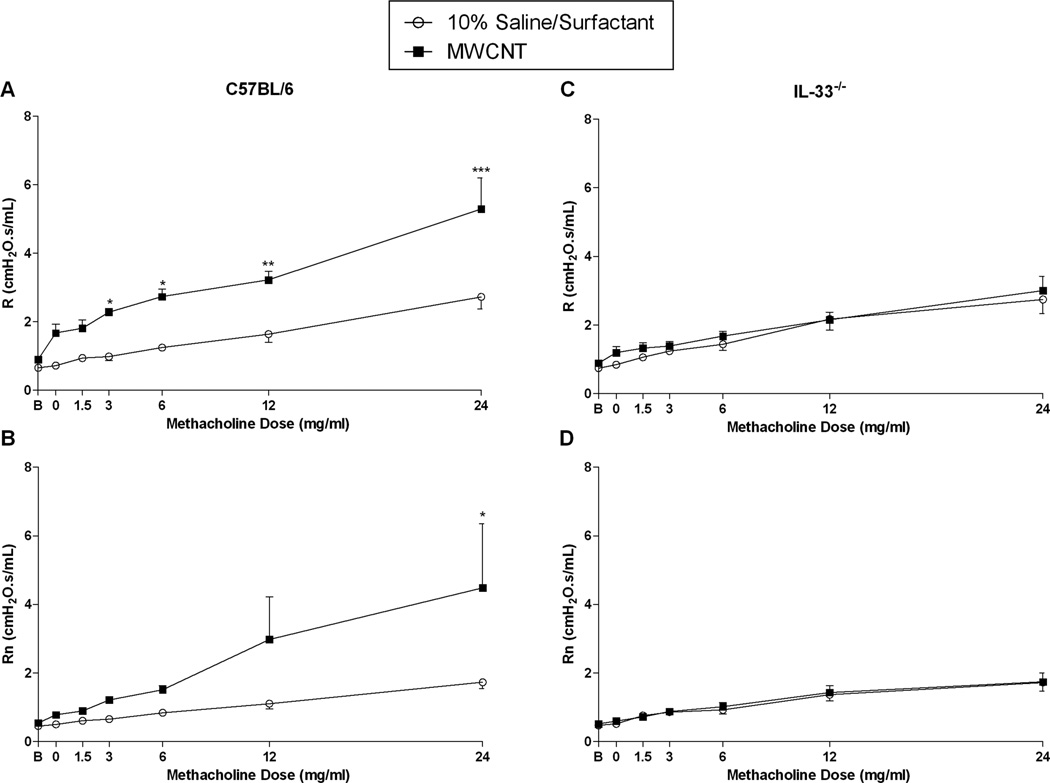
Figure 4.
Pulmonary resistance (R) and Newtonian resistance (Rn) dose response curves following challenge with increasing concentrations of methacholine in aerosolized saline (0, 1.5, 3, 6, 12, and 24 mg/ml) for C57BL/6 mice (A and B) and IL-33−/− mice (C and D) 30 days following instillation with vehicle (10% saline surfactant) or MWCNT. All data are expressed as mean ± SEM (n = 6/group). *p < 0.05, compared to vehicle (10% surfactant saline) exposed C57BL/6.

