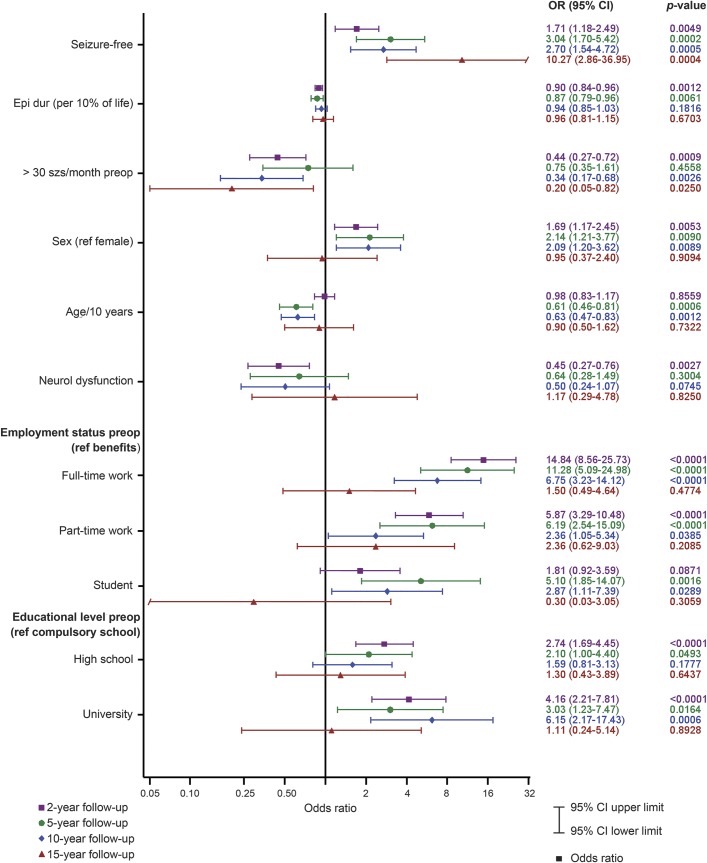
Figure 3. Univariate analyses of predictors for employment.
Forest plot of predictors for employment (full- or part-time) at 2, 5, 10, and 15 years after surgery. Retired patients were excluded from analyses. Age/10 years = age (per decade of life); Epi dur (per 10% of life) = epilepsy duration in percent of life length (increments of 10% units); neurol dysfunction = any neurologic dysfunction (including intellectual disability with a Full Scale IQ <70); OR = odds ratio; preop = preoperatively; ref = reference; szs = seizures.

