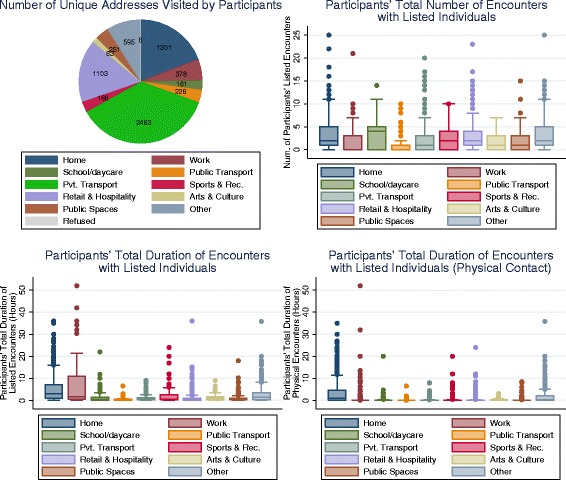
Fig. 2.

Characteristics of locations and encounters by location type. Summaries of locations and encounters from one study day for each participant, reported separately for each location type. The number of unique addresses visited by participants (top left panel). Boxplot for participants' total (weighted) number of encounters with listed individuals, by location (top right panel). Boxplot for participants' total (weighted) duration of encounters with listed individuals, by location (bottom left panel). Boxplot for participants' total duration of encounters involving physical contact with listed individuals, by location (bottom right panel). For all boxplots, boxes denote the interquartile range, interior lines shown the median and the whiskers show adjacent values. Across the boxplots, marked heterogeneity is apparent in several location types. For total duration of contact, Work (and Home to a lesser degree) is the dominant location type. For total duration of physical contact, home is the dominant location type. Boxplots use raking weights to reduce the effects of sample bias. For each location type, participants with no time spent at that location type do not contribute to those results
