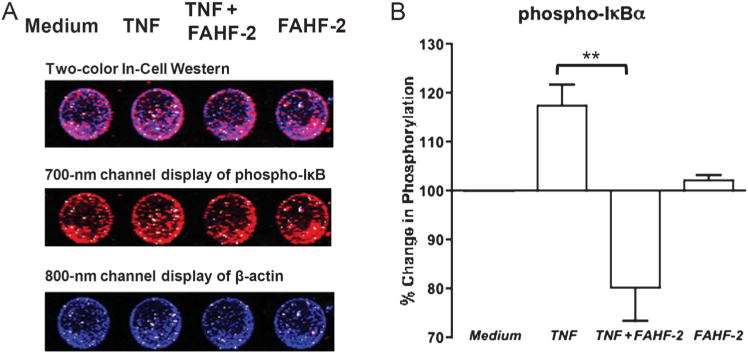
FIGURE 6.

A. Representative In-Cell Western with 700 and 800 nm channels detecting phospho-IκB and β-actin, respectively, in LPMCs cultured in medium, stimulated with TNF, stimulated and treated with FAHF-2, or with FAHF-2 alone. B. Percentage of phosphorylated IκB measured by In-Cell Western after TNF stimulation and with FAHF-2 treatment as compared with medium alone (n = 3). All values normalized to β-actin. **P< 0.01.
