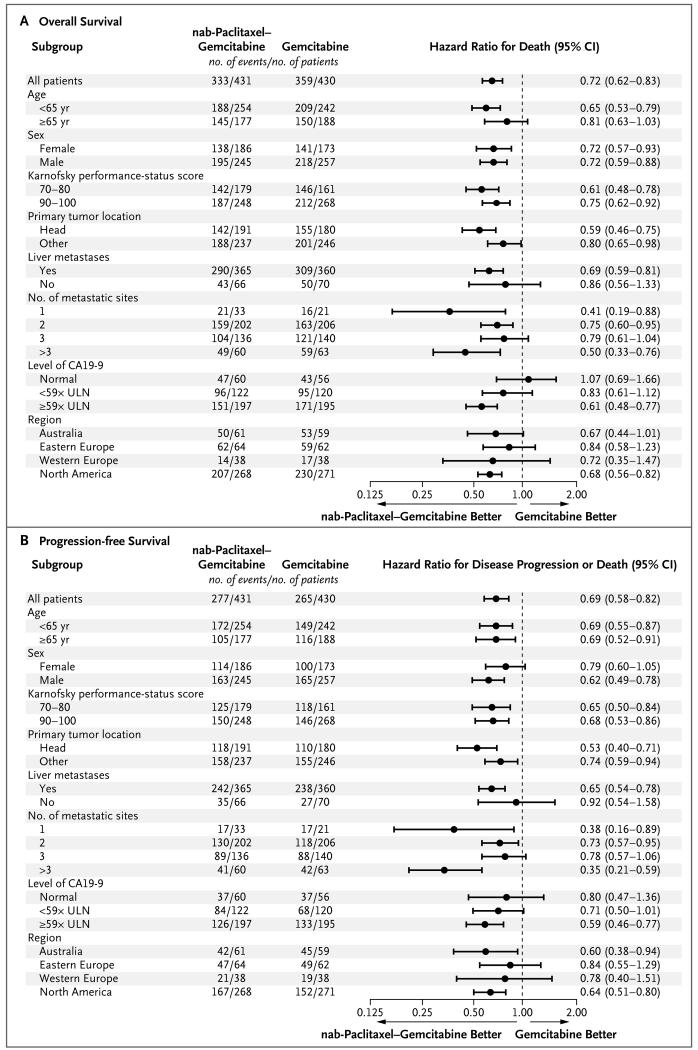
Figure 2. Forest Plots of the Treatment Effect on Survival and Progression-free Survival in Prespecified Subgroups.
Karnofsky performance-status scores range from 0 to 100, with higher scores indicating better performance status. CA19-9 denotes carbohydrate antigen 19-9, and ULN upper limit of the normal range.

